Available for Work
Problem
One of the significant challenges faced in the commercial building sector in Indonesia is the lack of detailed data and analysis capabilities regarding electricity consumption and behavior. Unlike residential properties, commercial buildings often lack specific, detailed data on their electricity usage, making it difficult for building management to monitor and optimize energy consumption effectively. This lack of data not only hinders their ability to identify patterns and anomalies in energy usage but also prevents them from taking immediate action to address inefficiencies or abnormalities.
————
Solution
To address the energy consumption and management needs of the commercial building sector, we propose the development of a web-based dashboard solution. This platform will provide building management and owners with comprehensive tools to monitor energy consumption, access real-time data, generate detailed reports, and manage billing efficiently.
Key features of the web dashboard solution include:
1. Real-Time Energy Monitoring: The dashboard will offer real-time monitoring of energy consumption for various systems within commercial buildings, including lighting, HVAC (heating, ventilation, and air conditioning), and appliances. Users can view energy usage data in intuitive graphs and charts to identify patterns and anomalies.
2. Customizable Reporting: The platform will allow users to generate customizable reports on energy usage, costs, and trends over time. Reports can be tailored to specific time periods, areas within the building, or types of energy-consuming devices, providing valuable insights for optimization and decision-making.
3. Billing Management: The dashboard will streamline billing processes by providing automated billing generation based on energy usage data. Building management can easily generate and distribute bills to tenants or occupants, track payment statuses, and manage billing disputes efficiently.
4. Energy Efficiency Recommendations: The platform will offer recommendations and suggestions for improving energy efficiency based on usage data and industry best practices. Users can access actionable insights and tips to optimize energy consumption, reduce costs, and minimize environmental impact.
5. Alerts and Notifications: The dashboard will feature customizable alerts and notifications to alert users to unusual energy usage patterns, potential equipment malfunctions, or billing discrepancies. This proactive approach enables building management to address issues promptly and prevent energy waste.
6. User Permissions and Access Control: The platform will support user permissions and access control features to ensure data security and confidentiality. Building owners can grant access to specific users or teams based on their roles and responsibilities within the organization.
By providing building management and owners with a powerful web dashboard solution, we aim to empower them to make data-driven decisions, optimize energy usage, and reduce operational costs. This solution not only enhances transparency and accountability but also promotes sustainability and environmental stewardship within the commercial building sector.
————
Research
Research on 7 business owners or building management, including office towers, apartments, hotels, and even factories, found that employees spend 2-6 hours every day every time they want to collect their building's electricity data, and the electricity data processing process also requires 1 up to 2 days until the final results come out, and also, some electricity expenses cannot be monitored because bills only come monthly, so it is difficult for business owners to know what is causing their bills to increase.
————
Persona

————
Ideation
Research we get from Mobile Apps, some features still can be relevant to the business sector. For Leastric Dashboard we explore some features from an application, such as real-time monitoring, and detailed data.
Based on our exploration and the research we done, we trying to make a dashboard that can display multiple devices with detailed data on it, so building management can make a decision on each floor or sector of their building. Real-time monitoring is still added to the dashboard as the main feature so the user can make a quick and minimize the faulty.
————
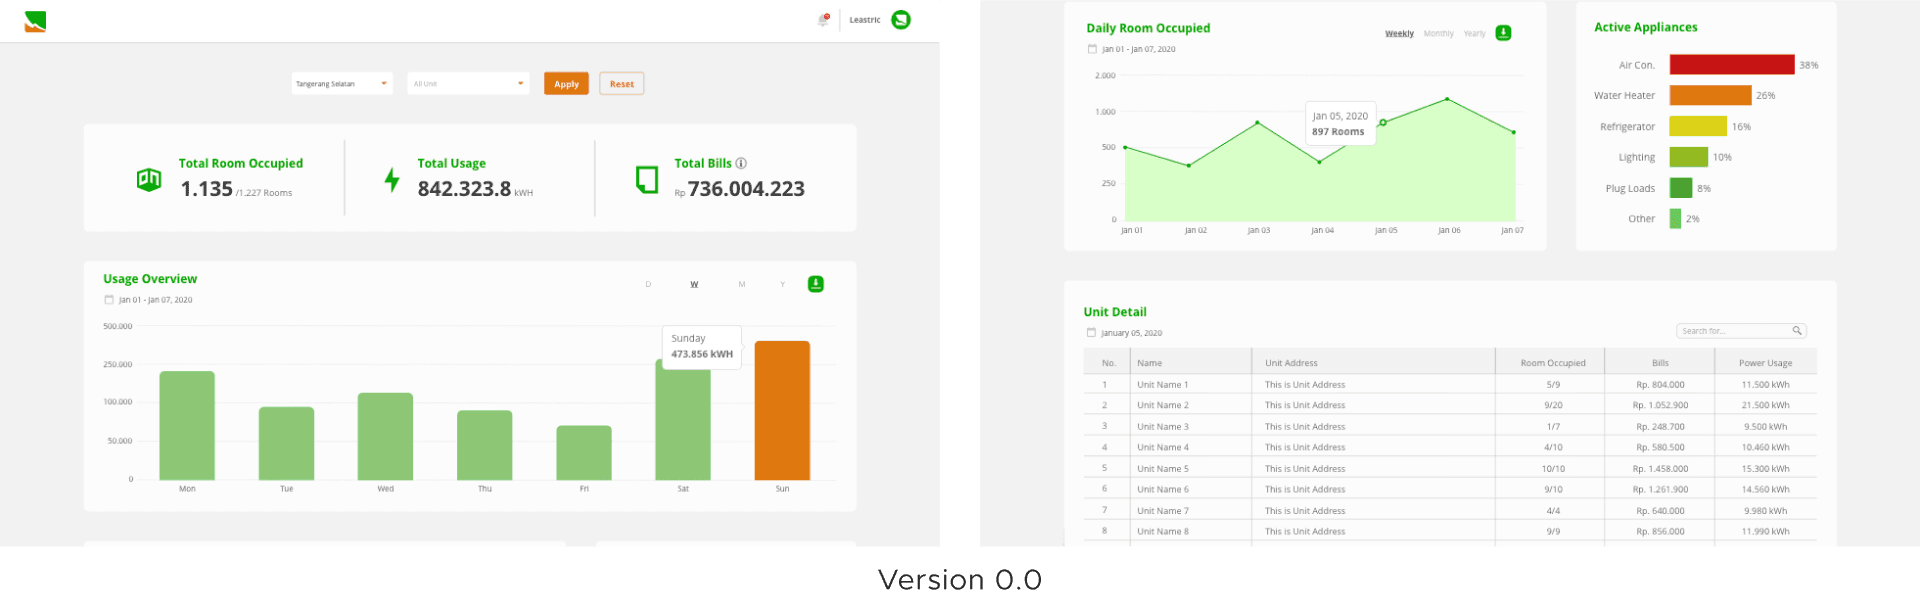
Initial Design
————
Iteration
Based on feedback from the mentors, peers, and users feedback, I revisited the design.
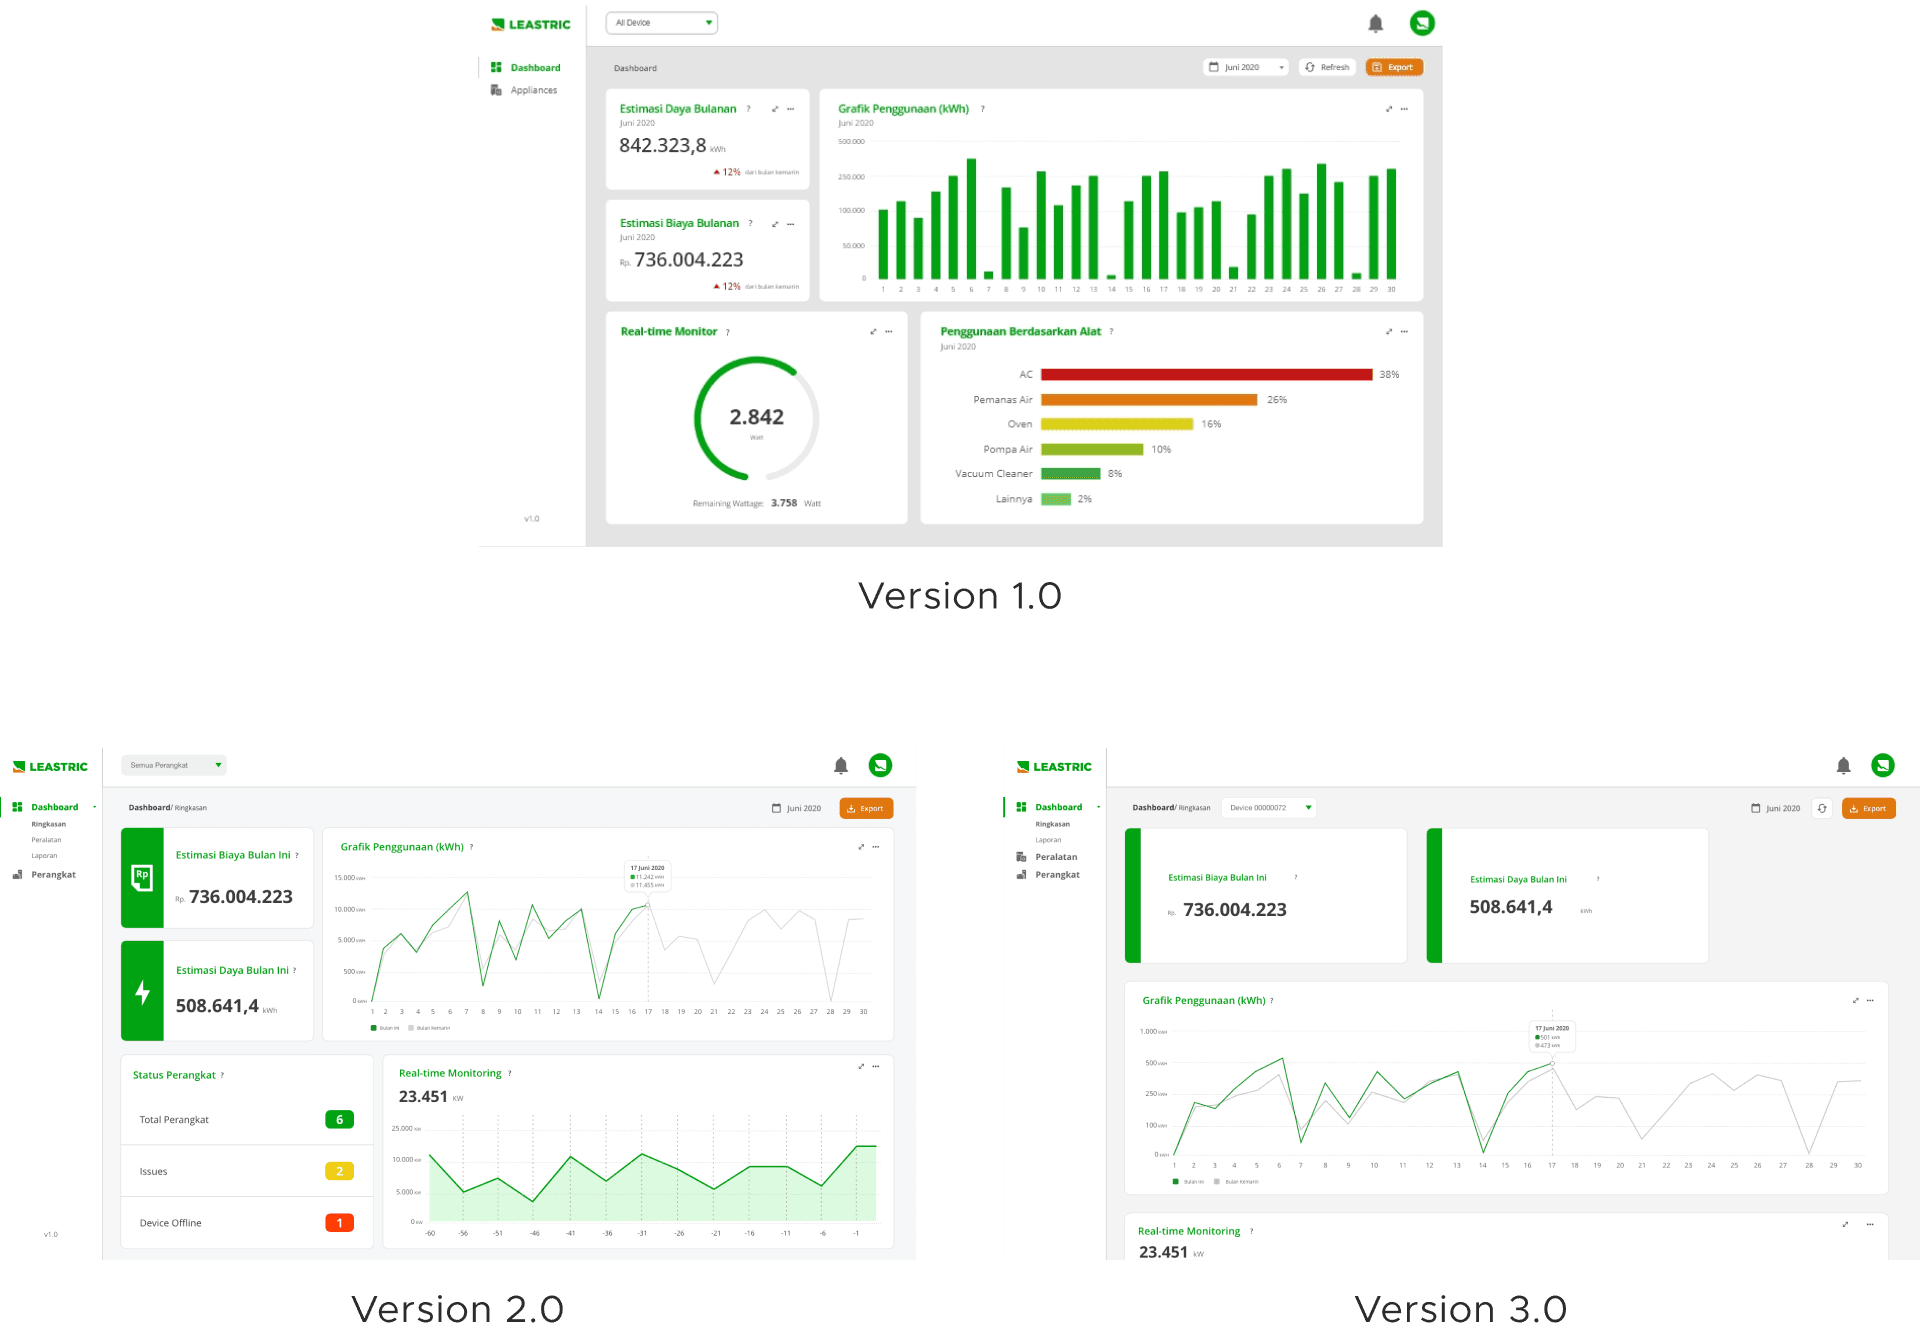
In the redesign process, I changed the highlighted points the initial design was only referring the mobile app design and made it a dashboard layout, but refer to others' dashboard designs I improved the layout to what the dashboard usually looks, and added the devices page and appliances page, so the user can monitor their devices too for the decision-making process.
for further Usability testing for user and also our customers, I added a comparison features and some temperature data displays.
————
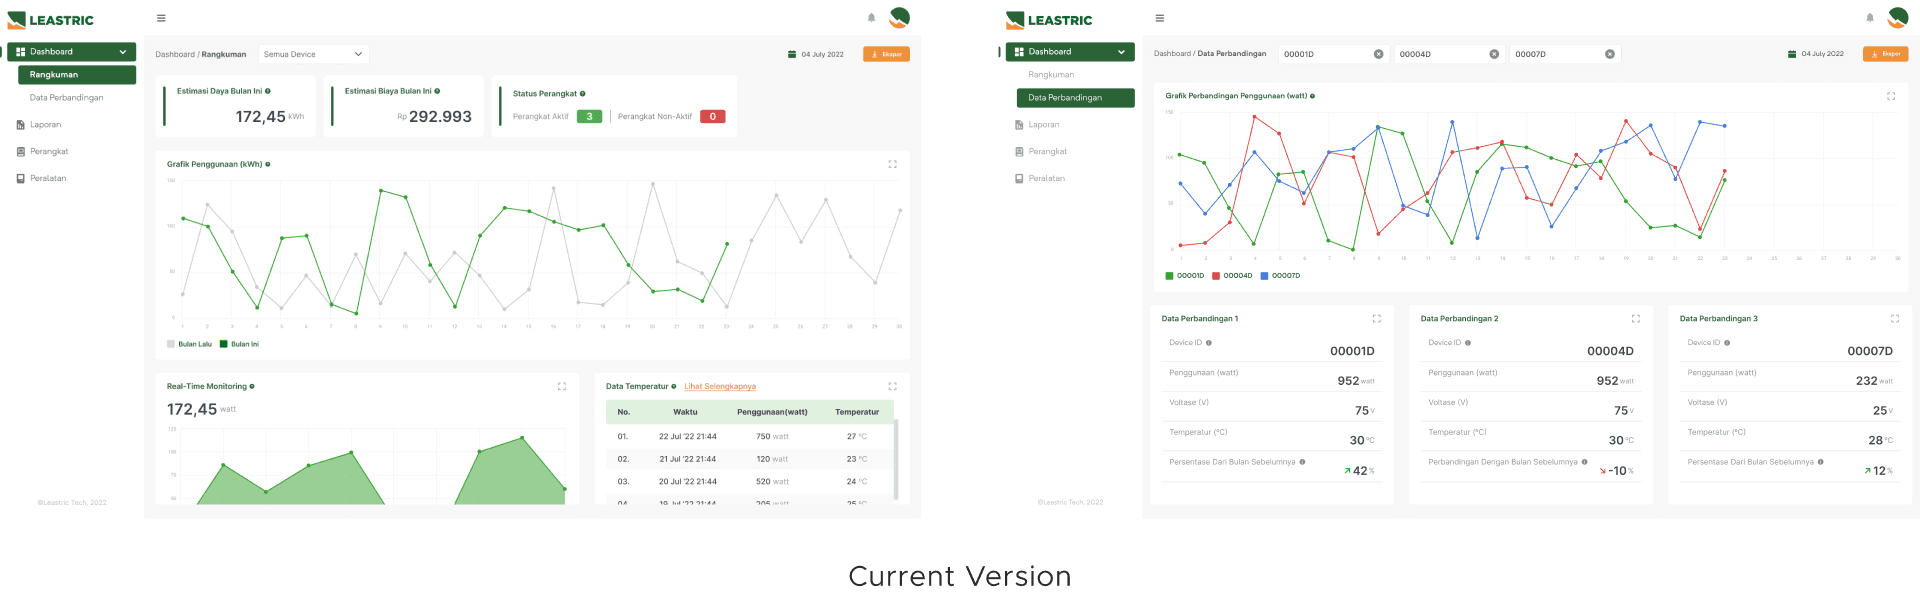
Updated Design
I develop designs based on research results and feedback obtained. As a result of these improvements, it was recorded that there are already 3 versions, until now the development process is still being carried out to maintain the user journey and also the data density required by the client.
————
Upcoming Design